WASTE & RECYCLING: DATA, MAPS, & GRAPHS (Some of the statistics below are dated, but the methodology and other information is still relevant.)
CHECK THESE SOURCES FOR WASTE DATA: (Keep in mind, state reports are not being checked by the EPA to make sure that waste and recycling data is accurate.)
EPA (Environmental Protection Agency) uses Franklin Associates - http://www.fal.com/index.html (See more about Franklin Asso. below). Also see EPA Municipal Solid Waste (MSW) reports: http://www.epa.gov/osw/nonhaz/municipal/msw99.htm, and 1960-2008 chart: http://www.epa.gov/osw/nonhaz/municipal/pubs/msw2008rpt.pdf.
BIOCYCLE (JG Press): State of Garbage in America (Biocycle Magazine has published annual waste generation reports by states for many years. Below are some of the latest issues. Contact Nora Goldstein for more information, call 610-967-4135, or http://www.jgpress.com/contact_us.html
1989-2006: http://www.jgpress.com/images/art/0812/sog08_tables.pdf
2008: http://www.jgpress.com/archives/_free/001782.html
2007: http://www.jgpress.com/archives/_free/001280.html
2006 http://www.jgpress.com/archives/_free/000848.html* Biocycle may stop publishing this report due to difficulty getting state reports. (Lynn Landes July 30, 2010)
ALSO SEE:
- ZWA's 1998 State of the Nation's Waste (INCLUDES CHARTS)
- EPA's non-enforcement of state reporting requirements
- Economics of Waste
Other news sources: Waste&RecyNews
Year 2002: (This note is dated, but nothing of substance has changed). Waste management in the U.S. is in a state of anarchy with no effective federal plan in place to maximize recycling and minimize waste. America generates more waste every year, growing from a 247 million tons of non-hazardous waste in 1990, to 409 million tons in 2001, according to Biocycle magazine, an industry publication.
Although 32% of municipal waste is reported to be recycled, there are two problems with this picture. One is that the Environmental Protection Agency (EPA) estimated in 1988 that municipal waste was only 2% of all waste generated, and secondly, the total amount of waste generated, recycled, or disposed is not truly known because the EPA has not collected or confirmed that data. Failure to so is in violation of federal requirements. See: EPA'S non-enforcement
Lastly, waste disposal statistics do not take into account waste that is disposed (burned or landfilled) on-site or off-site in unpermitted landfills (dumps) and incinerators (including burn barrels). The statistics also do not include waste that is recycled in an environmentally destructive manner (so-called 'beneficial use' recyclables).
STATES PERFORMANCE:
In ZWA's 1998 State of the Nation's Waste (includes charts), ZWA created an innovative formula to judge a state's municipal waste management performance based a state's waste management on the amount of municipal waste a state generates, minus the percentage recycled, plus waste imports and exports, then divided by their population.
Local Waste Disposed + Imports + Exports - Recycled ![]() by Population = Waste Mgt. Performance
by Population = Waste Mgt. Performance
Based on the principal that states can and should manage their own waste, ZWA's performance formula penalizes states who import or export waste. ZWA identifies four strategies states can employ to eliminate waste disposal, imports, and exports: 1) implement waste disposal bans, 2) support markets for recyclables, 3) restrict land use, and 4) raise state taxes on the amount of waste disposed.
![]() For more information on WASTE IMPORTS, see: Bans & Imports
For more information on WASTE IMPORTS, see: Bans & Imports
A YEARLY SNAPSHOT OF U.S. (municipal) WASTE & RECYCLING
Data source:BIOCYCLE / Table & Conversion: ZWA
| Survey of Previous Year | U.S. Population | (mostly) MunicipalWaste Generated (tons) | Increase | Percentage Recycled | Tons Disposed | Tons Disposed Per Person |
| 1990 | 246,819,230 | 269,000,000 | --------- | 8% | 247,480,000 | 1.002 |
| 1991 | 249,439,545 | 293,613,000 | +24,613,000 | 11.5% | 259,847,000 | 1.041 |
| 1992 | 252,124,362 | 280,675,000 | -12,938,000 | 14% | 241,380,000 | 0.957 |
| 1993 | 255,001,827 | 291,742,000 | +11,067,000 | 17% | 242,146,000 | 0.949 |
| 1994 | 257,752,702 | 306,866,000 | +15,124,000 | 19% | 248,561,000 | 0.964 |
| 1995 | 260,292,437 | 322,879,000 | +16,013,000 | 23% | 248,617,000 | 0.955 |
| 1996 | 262,760,639 | 326,709,000 | +3,830,000 | 27% | 238,498,000 | 0.907 |
| 1997 | 265,179,411 | 327,460,000 | +1,751,000 | 28% | 235,771,000 | 0.890 |
| 1998 | 267,636,061 | 340,466,000 | +13,006,000 | 30% | 238,326,000 | 0.890 |
| 1999 | 272,690,813 | 374,631,000 | +34,165,000 | 31.5% | 267,108,215 | 0.979 |
| 2000 | 280,000,000 estimate | 382,594,000 | +7,963,000 | 33% | 256,338,000 | 0.661 |
| 2001 | 286,345,000 | 409,029,000 | +26,435,000 | 32% | 278,139,720 | 0.979 |
- BIOCYCLE uses state reports that may list other types of waste in addition to municipal waste.
Year 2000 LEADING WASTE IMPORTERS AND EXPORTERS:
Data source: BIOCYCLE / Table & Conversion: ZWA
WASTE IMPORTERS | TONS | WASTE EXPORTERS | TONS |
| 1.Pennsylvania 3. Virginia 4. Michigan 2. Illinois 5. Indiana | 9,764,000 3,891,000 3,124,000 1,548,000 1,531,000 | 1. New York 2. New Jersey 3. Missouri 4. Maryland 5.Massachusetts | 5,600,000 1,800,000 1,793,000 1,547,000 1,218,000 |
BIOCYCLE - uses state reports that may list other types of waste in addition to municipal waste.
FOREIGN WASTE IMPORTS? Data source: http://www.jgpress.com/ Table: ZWA
TOTALS OF STATE WASTE IMPORTS & EXPORTS:
| Year | Waste Imports (tons) | - minus Exports | = Foreign Waste? |
| 1998 | 21,319,000 | - 13,977,000 | = 7,342,000 |
| 1999 | 32,837,370 | - 14,899,090 | = 17,938,280 |
| 2000 | 38,901,100 | - 16,090,000 | = 22,811,100 |
| 2001 | 30,567,000 | - 18,255,030 | = 12,311,970 |
| Totals | 123,624,470 | - 63,221,120 | = 60,403,350 |
The annual total "imported" waste by states minus the total "exported" waste by states, appears to be the amount of imported foreign "municipal" waste. This does not include other types of foreign waste imports.
![]() Also see: Global Waste Trade
Also see: Global Waste Trade
EPA'S NON-ENFORCEMENT OF STATE DATE REPORTING REQUIREMENTS
The EPA does not accurately report, nor require states to report, the total amount of waste that is generated, disposed, recycled, imported, or exported in the United States. Only the import and export of hazardous waste across national borders is tracked. Without this information, states cannot develop or implement a Solid Waste Management Plan or conduct a meaningful EIS (Environmental Impact Statement). It is a clear violation of the Solid Waste Disposal Act (RCRA) -
"U.S.C. TITLE 42 - THE
PUBLIC HEALTH AND WELFARE, CHAPTER 82 - SOLID WASTE DISPOSAL
SUBCHAPTER IV - STATE OR REGIONAL SOLID WASTE PLANS § 6942. Federal guidelines for
plans (b)
Guidelines for State plans -
Not later than eighteen months after October 21, 1976, and after
notice and hearing, the Administrator shall, after consultation
with appropriate Federal, State, and local authorities,
promulgate regulations containing guidelines to assist in the
development and implementation of State solid waste management
plans (hereinafter in this chapter referred to as "State
plans"). The guidelines shall contain methods for achieving
the objectives specified in section 6941 of this title. Such
guidelines shall be reviewed from time to time, but not less
frequently than every three years, and revised as may be
appropriate. (c) Considerations for State plan guidelines - The
guidelines promulgated under subsection (b) of this section shall
consider - (8) the constituents and generation rates of waste..."
COUNTING WASTE, BUT WHAT IS WASTE?
Municipal waste is, at most, 20% of the reported total waste stream, according to Pennsylvania's estimates. However, some estimates put it as low as 2%. According to Peter G. Miller, "... in the files of the EPA is a 1988 Report to Congress, Solid Waste Disposal in the United States. On page 11 of Volume 1 a chart shows all Subtitle D (municipal landfill) wastes EPA reported to Congress -- that would be 11.387 billion tons. Of this total, less than 2 percent is represented by MSW." If that chart does not include hazardous waste, then the 2% figure would be even lower."*
Municipal waste includes: durable goods, nondurable goods, containers & packaging, food wastes, and yardwaste. However, other wastes may also be disposed in municipal landfills, including: municipal sludge, industrial non-hazardous waste, construction and demolition debris, agricultural waste, oil and gas waste, mining waste, and hazardous waste.
The Environmental Protection Agency (EPA) estimates the total cost of municipal waste disposal is $100 per ton. Therefore, the cost of ‘municipal’ waste disposal in the U.S. could be $23.8 billion. This figure does not include the associated financial costs of lost resources or the costs of landfills and incinerators on public health and the environment. Also see: Environmental Economics & ZWA's 1998: State of the Nation's Waste (& Recycling)
The EPA does not require states to report the total amount of waste that is generated, disposed, recycled, imported, or exported in the United States, even though federal law requires such reports- see below: A Critique of the Methodology the EPA.
(Note: ZWA has ordered the 1988 Report To Congress in order to confirm the above information. The report has never been updated. ZWA hopes to obtain some updated data from EPA staff. To order the Report, call 1-800-490-9198, Order # EPA530SW88011A. (9/3/99).)
![]() U.S. Federal Definitions of Waste Types - click here
U.S. Federal Definitions of Waste Types - click here
EPA'S FRANKLIN ASSOCIATES vs BIOCYCLE:
In addition, the methodology the EPA uses to gather national waste generation data is flawed. The EPA subcontractor, Franklin Associates (http://www.fal.com/index.html), produces an annual report of "municipal" waste generation data, by polling producing U.S. industries volumes generated; not disposal data. Franklin does not include waste generated overseas to manufacture products for export to the U.S. Nor does Franklin track waste imported or exported. Franklin cannot confirm that the recycling rate is accurate, because there is widespread non-enforcement, nor is there a prohibition against the disposal of recyclables.
BIOCYCLE publishes The State of the Nation's Garbage. It's methodology is somewhat better than Franklin's reports, although far from a truly accurate measure of American's waste disposal & recycling habits. Biocycle gathers its data from the states generation, recycling, and disposal reports (from landfills and incinerators). It does not report on hazardous waste, although hazardous waste may be included in these reports. (EPA allows municipal landfills to take limited quantities of hazardous waste from an unlimited number of companies.) State reports vary widely regarding content. For instance, one state may include construction/demolition debris or sewage sludge, and another state won't.
In addition, disposal of waste that masquerades as recycling may be reported, such as the recycling (incineration) of hazardous and residual (industrial) waste in cement kilns and land application of sewage sludge. Since the states are not being required by the EPA to make reports, some of the data Biocycle receives are several years old or not reported at all.
BIOCYCLE publishes, "The State of Garbage in America" and reports data on "municipal" waste generation, disposal, recycling, etc. This annual issue will be newly scheduled for every November. For Part 1 in 1999 (April issue) and 1998 (April issue). Biocycle magazine address: The JG Press, Inc., 419 State Avenue, Emmaus PA, 18049. Phone: 800-661-4905 or 610-967-4135.
WASTE DISPOSAL CAPACITY Confusion
NUMBER OF LANDFILLS vs. WASTE DISPOSAL CAPACITY
Fewer landfills does not mean less waste disposal or capacity. In 1978, there were approximately 20,000 landfills. By 1988, that number had dropped to 5,499. Currently the figure stands at 3,091. The EPA estimates that by the year 2008, only 1,234 landfills will be available. (Source: EPA and Mark Mardon, Earth Island Institute) In 1997, Americans generated 340 million tons of municipal waste, which averaged 1.272 tons per person. The recycling rate was 30%, for a total amount of 238 million tons, or 0.890 tons of waste disposed per person. By comparison, in 1990, Americans generated 269 million tons at an average of 1.089 tons per person, recycled 8%, for a total disposal of 247 million tons, or 1.002 tons per person. (Source: ZWA's 1998 State of the Nation’s Waste report)
'CAPACITY' CONFUSION:
Waste disposal capacity can be a very confusing topic. The definition of 'capacity' varies with varying circumstances. At its most basic, 'capacity' is a limited resource only in terms that the earth is a finite place. In reality, the government can increase 'capacity' (i.e., issue more permits) at any time.
'Permitted capacity' is the amount of waste a disposal facility is 'permitted' to take on a daily basis (called daily volume) for an approximate length of time to fill up a defined amount of space (air and ground space). If the facility does not use all its allotted daily volume, the life of the landfill will be longer.
In 1997, Pennsylvania's Dept. of Environmental (DEP) officials stated that PA had 10-15 years of waste disposal capacity remaining. However, that prediction was based on previous usage, which was sometimes 50% of permitted capacity. If usage increases, then remaining disposal capacity will descrease.
Here are some formulas that may help to distinguish the different types of capacity:
- Permitted capacity = Used capacity + Unused capacity
- Unused capacity = Remaining capacity
- Remaining capacity = Permitted daily volume (x # of days in expected life of permit) - (minus) Used daily capacity (x # of days this volume was used). Note: If daily volume varied significantly, you would have to use this formula for each significal variation in order to estimate remaining capacity.
How much waste disposal 'capacity' really exists? The earth is at our disposal, according to some waste industry representatives, who contend that landfills and incinerators can be built almost anywhere.
DIFFERENT STATISTICS FROM THE EPA...
"In the United States, we generated approximately 220 million tons of municipal solid waste (MSW) in 1998--an increase of 4 million tons from 1997. The recovery rate for recycling (including composting) continued to grow, but at a slower rate. In 1998, the nation’s overall recycling rate was 28.2 percent. This is up 0.8 percent from the previous year.
MSW generation in 1998 remained relatively stable, at 4.46 pounds per person per day. This is a slight increase of 0.03 pounds per person per day compared to 1997. The recycling rate was 1.26 pounds per person per day, and discards after recycling remained unchanged at 3.20 pounds per person per day.
Source reduction efforts have helped to keep waste generation rates under control. The state of the economy has a direct impact on consumption and waste generation. With the strong economic growth that has occurred throughout the 1990's, waste generation has continued to increase. Despite this, the total per capita waste generation has remained unchanged from 1997 to 1998. On-site yard waste composting, use of mulching mowers, and reductions in the weight of beverage containers have been the main reasons for this success."
__________________
Source: EPA-Characterization of Municipal Solid Waste in the United States: 1999 Update Fact Sheet (Adobe Acrobat PDF File)Waste & Recycling Characterization, Franklin Report. EPA's standard reference for waste composition, generation, and management numbers. Prepared by Franklin Assoc's. using EPA's materials flow methodolgy. US Environmental Protection Agency, OSW Publications Distribution Center, Mail Code: 5305, Washington, DC 20460; (800) 424-9346.
EPA'S WASTE & RECYCLING DATA (
- OFFICE OF SOLID WASTE - INDEX
- EPA'S Facts and Figures on Municipal Solid Waste (charts&graphs)
Characterization of Municipal Solid Waste in the United States: 1999 Update Fact Sheet
NOTE: 4.5 lbs. per person per day = .821 tons per person per year
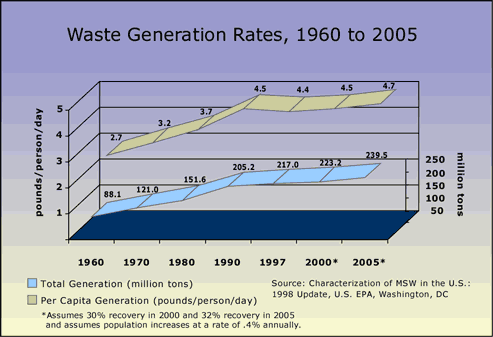
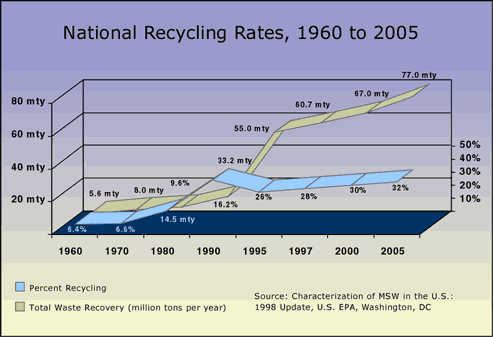
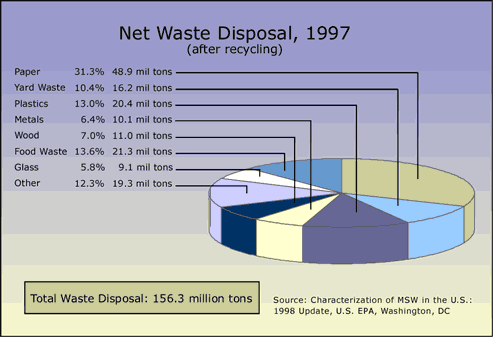
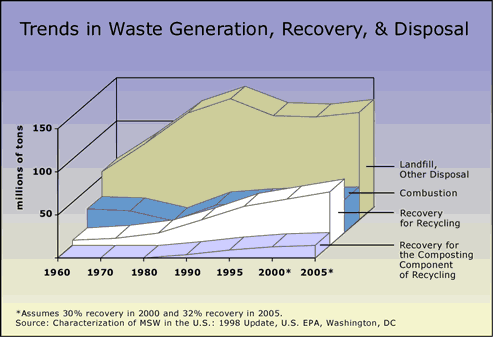
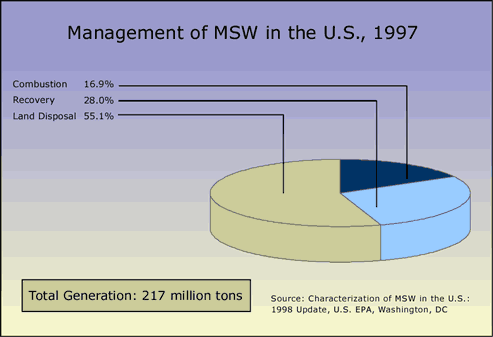
Waste Management Practices, 1960-2005 | |||||||
| 1960 | 1970 | 1980 | 1990 | 1995 | 2000* | 2005* | |
| Waste Generated | 100% | 100% | 100% | 100% | 100% | 100% | 100% |
Recycled/Composted | 6.4% | 6.6% | 9.6% | 16.2% | 26% | 30% | 32% |
| Incinerated | 30.6% | 20.7% | 9.0% | 15.5% | 16.8% | 16.7% | 15.9% |
| Landfilled | 63% | 72.6% | 81.4% | 68.3% | 57.2% | 53.3% | 52.1% |
Source: Characterization of MSW in the U.S.: 1998 Update, U.S. EPA, Washington, DC | |||||||
WASTE & RECYCLING: DATA, MAPS, & GRAPHS
(Some of the statistics below are dated, but the methodology and other information is still relevant.)
CHECK THESE SOURCES FOR WASTE DATA:
(Keep in mind, state reports are not being checked by the EPA to make sure that waste and recycling data is accurate.)
EPA (Environmental Protection Agency) uses Franklin Associates - http://www.fal.com/index.html (See more about Franklin Asso. below). Also see EPA Municipal Solid Waste (MSW) reports: http://www.epa.gov/osw/nonhaz/municipal/msw99.htm, and 1960-2008 chart: http://www.epa.gov/osw/nonhaz/municipal/pubs/msw2008rpt.pdf.
BIOCYCLE (JG Press): State of Garbage in America (Biocycle Magazine has published annual waste generation reports by states for many years. Below are some of the latest issues. Contact Nora Goldstein for more information, call 610-967-4135, or http://www.jgpress.com/contact_us.html
1989-2006: http://www.jgpress.com/images/art/0812/sog08_tables.pdf
2008: http://www.jgpress.com/archives/_free/001782.html
2007: http://www.jgpress.com/archives/_free/001280.html
2006 http://www.jgpress.com/archives/_free/000848.html* Biocycle may stop publishing this report due to difficulty getting state reports. (Lynn Landes July 30, 2010)
ALSO SEE:
- ZWA's 1998 State of the Nation's Waste (INCLUDES CHARTS)
- EPA's non-enforcement of state reporting requirements
- Economics of Waste
Other news sources: Waste&RecyNews
Year 2002: (This note is dated, but nothing of substance has changed). Waste management in the U.S. is in a state of anarchy with no effective federal plan in place to maximize recycling and minimize waste. America generates more waste every year, growing from a 247 million tons of non-hazardous waste in 1990, to 409 million tons in 2001, according to Biocycle magazine, an industry publication.
Although 32% of municipal waste is reported to be recycled, there are two problems with this picture. One is that the Environmental Protection Agency (EPA) estimated in 1988 that municipal waste was only 2% of all waste generated, and secondly, the total amount of waste generated, recycled, or disposed is not truly known because the EPA has not collected or confirmed that data. Failure to so is in violation of federal requirements. See: EPA'S non-enforcement
Lastly, waste disposal statistics do not take into account waste that is disposed (burned or landfilled) on-site or off-site in unpermitted landfills (dumps) and incinerators (including burn barrels). The statistics also do not include waste that is recycled in an environmentally destructive manner (so-called 'beneficial use' recyclables).
STATES PERFORMANCE:
In ZWA's 1998 State of the Nation's Waste (includes charts), ZWA created an innovative formula to judge a state's municipal waste management performance based a state's waste management on the amount of municipal waste a state generates, minus the percentage recycled, plus waste imports and exports, then divided by their population.
Waste Disposed (or Generated - Recycled) + Imports + Exports ÷ Population = Performance
Based on the principal that states can and should manage their own waste, ZWA's performance formula penalizes states who import or export waste. ZWA identifies four strategies states can employ to eliminate waste disposal, imports, and exports: 1) implement waste disposal bans, 2) support markets for recyclables, 3) restrict land use, and 4) raise state taxes on the amount of waste disposed.
![]() For more information on WASTE IMPORTS, see: Bans & Imports
For more information on WASTE IMPORTS, see: Bans & Imports
A YEARLY SNAPSHOT OF U.S. (municipal) WASTE & RECYCLING
Data source:BIOCYCLE / Table & Conversion: ZWA